


The global economy’s heartbeat
How the 10-year treasury note reflects economic health, and what it may be telling us now

Welcome to the Crashes newsletter! If you haven’t subscribed, join our community by subscribing here:
The global economy is like a living organism. It’s a system.
You can gauge an organism’s health by measuring its physical signs. For example, doctors listen for irregularities in a patient’s heart. There’s a baseline heart rate pattern—a beat and sound that is considered normal given a patient’s circumstances. Doctors study these patterns. They know what to listen for to infer health.
The US dollar is the global reserve currency—the lifeblood of the global economy. The 10-year US treasury note is its heartbeat.
Last week, starting on Monday April 7th, the 10-year US treasury note had palpitations. It moved in unexpected ways. Markets were selling them, which is unusual during times of economic uncertainty.
To understand what this actually means, you have to know what to look for.
Why the 10-year treasury note matters
When the US government spends more than its revenues, the US Treasury issues debt to finance these deficits. There are several types of debt it can choose from.
It can issue short-term debt to be repaid in less than a year, which are called bills. It can issue medium-term debt to be repaid in 2-10 years, which are called notes. It can also issue long-term debt to be paid in 20-30 years, which are called bonds.
10-year notes are one of the most widely traded in the world. There is a deep and liquid market for them. Basically, when someone wants to buy or sell these, it’s easy to determine its price and find a counterparty. These are so ubiquitous that they are often referred to simply as treasuries.1
After World War II the US dollar became the global reserve currency. The US is a global superpower with the world’s biggest economy and a historically stable, trustworthy government. The US always pays its debts. As a result, lending to the US government has historically been viewed as the safest way to store capital.
Whereas other borrowers must compensate lenders for a combination of the time value of money and the probability of default, the US government only has to pay for the time value of their money.2 In that sense, US debt is viewed as “risk-free.”
In practice, this means that markets use the yield on treasuries—the interest payment divided by the price of the treasury note, which may be less than the original principal—as the baseline from which to price incremental risk.3 For example, mortgages are generally priced using the yield on treasuries plus an extra amount to compensate for the probability of default. If the treasury yield is 5%, the market may demand an additional 2% to compensate lenders for that additional risk, and may therefore demand borrowers pay 7% interest on their mortgages.
However, there are limitations to risk-free pricing.
Yields on Treasuries are market-driven. The Federal Reserve sets targets for what’s called the federal funds rate. That’s the short-term rate at which banks lend to each other, typically overnight.4
But the yield for US government debt issued to investors is set by the market.5
Markets view the US as stable and reliable. But that condition is not static. Similar to the global economy, the US is a living system. It can change. It might catch inflation or fall into recession. Economic ailments influence demand, which drives prices.
Interest rates on treasuries are the price the US pays to borrow from investors. Since treasuries are the lifeblood of the global economy, they are a powerful window into economic well-being.
To the trained eye, movements in yields can signal changes in growth or inflation expectations, risk appetite by market participants, and the future outlook of Fed policy. They can also signal economic uncertainty, and even fear, during economic crises.
For decades, economic crises have led to a signature pattern in treasury yields—when markets are crashing, investors rush to the safety of treasuries driving yields down.
How a rush to treasuries plays out
Let’s set the stage. Picture an investor with $100 in assets. Half of those assets are stock in a flashy bank with huge profits, let’s call it Leverage Brothers. She also has $40 in a diversified portfolio of corporate bonds earning 6% in interest per year, and $10 invested in 10-year notes earning 4% per year.
Given her concentration in Leverage Brothers, she’s auditing their hot-off-the-press financial statements to decide whether to double-down on their recent profitability. As she reads a footnote on their balance sheet, she realizes that unrealized profits on illiquid office buildings make up the majority of their earnings. She also realizes they bought these using loans for 97% of their purchase price.
Coincidentally, she lives near these buildings and she knows that the tenants are moving out. She decides to sell her stake in Leverage Brothers. Unfortunately, other market participants realize the same thing at the same time. Everyone now expects the value of the buildings will be lower, but how much lower? No one knows. Some are even suggesting it may be zero.
To make matters worse, the loans that funded Leverage Brothers’ purchases were provided by all the major banks. If those buildings are worth zero, they will face heavy losses too. And if those banks face heavy losses, all the regular companies they serve might be unable to get loans to run their business. They might not even be able to access cash in their bank accounts.
She’s now panicking along with the rest of the market. She calls her broker to sell everything. “I can’t tell who’s exposed here! I don’t want any risk,” she says. “Move everything to US treasuries where I can earn interest and ride this out safely.”
The stock market sells off, and investors pour into treasuries. On a screen, stock market indices like the S&P 500 would show sharp moves downward while treasury yields—the price the US government pays to borrow—would also move sharply down. Investors want safety at almost any price to protect the value of their financial capital. As they all compete for limited spaces in the safe haven, they drive down the price of US debt—the yield on treasuries.
What a rush to treasuries actually looks like
This pattern has been remarkably consistent in modern history. A crisis hits. The market rushes away from risky assets and floods into US treasuries. Treasury yields go down.
There are three exceptions—situations when yields might go up despite a stock market crash:
When investors use debt to fund investments—also known as levered bets—and those investments decline in price, they may be forced to sell treasuries in order to cover their losses. When that happens to a substantial number of market participants—usually from surprise market moves—the combined volume of forced treasury sales may temporarily drive yields up.
When markets fear a systemic failure—a loss of confidence in financial plumbing—investors rush into physical cash, short-term bills, or hard assets like gold. No one wants to lend the government money for 10 years if the system is about to collapse.
When markets lose confidence in the US as a stable and reliable haven for capital. This dynamic is common in emerging markets. History is littered with emerging market governments that lost credibility, triggered a massive outflow of capital, and defaulted on their debt. While this has never happened in the US, there’s no guarantee that it can’t.6
A sample of recent crises can provide a good feel for what all of this looks like.
Black Monday, 1987
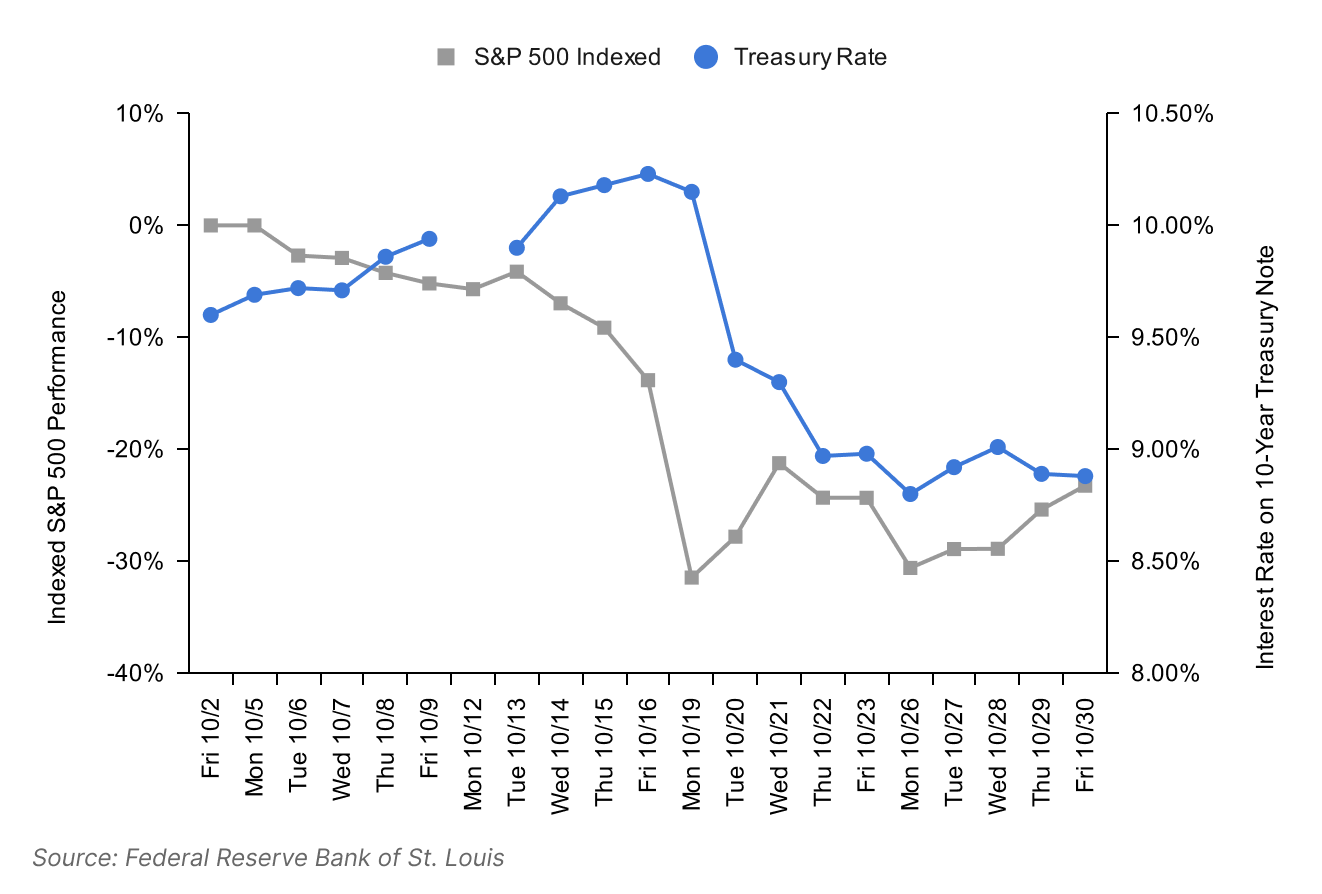
On Monday October 19th, 1987, the US stock market suffered a sudden crash. The stock market had gone up consistently since 1982 to accumulate gains of roughly 200%.
However, there were clouds on the economic horizon. Selling momentum triggered automated trading that amplified the original selling pressure and caused an avalanche of selling.
In a single day, the S&P 500 declined by 20%. The treasury yield, which had been inching up as the Fed tightened monetary policy, declined more than 140 basis points as investors fled to safety (Figure 1).
Collapse of Long-Term Capital Management (LTCM), 1998
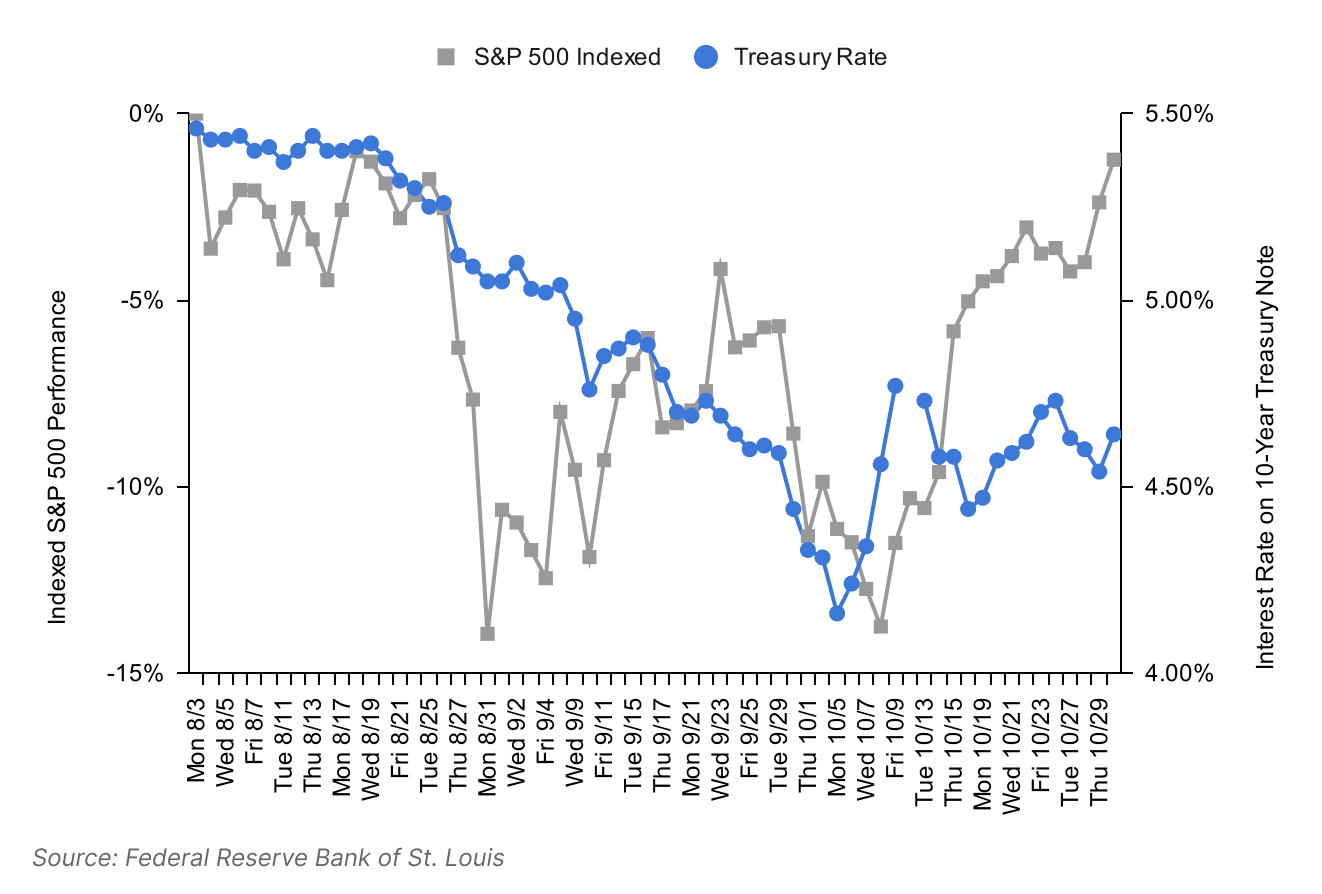
LTCM was a hedge fund led by renowned economists and traders. It had built massive positions funded with colossal amounts of debt. They were betting, among other things, that the price of Russia’s short-term sovereign debt would converge with the price of its long-term debt.
In August 1998, Russia unexpectedly defaulted on its debt and devalued its currency. Instead of converging, the spread between short-term and long-term debt blew out. Market liquidity for these assets evaporated. LTCM’s bets faced catastrophic losses and were effectively impossible to sell.
More importantly, they were intertwined with the financial system with over $1 trillion in notional exposure through derivatives. Fearing a major financial crisis, markets collapsed. The S&P 500 declined roughly 15% in August. Treasury yields declined about 130 basis points as investors fled to safety (Figure 2).
The New York Fed coordinated a rescue announced on September 23rd where major financial institutions effectively bought LTCM for $3.625 billion. This calmed the markets temporarily but by late September lingering fears of global contagion drove more selling in the stock market.
Notably, treasury yields increased in early October. Hedge funds, including LTCM, with leveraged bets were forced to sell treasuries to cover losses.
Conditions stabilized after the Fed cut interest rates in mid-October, the market digested the LTCM rescue, and credit conditions stabilized.
Global Financial Crisis, 2007-2009
Starting in 2003, a combination of lower underwriting standards and aggressive mortgage products inflated a major bubble in the US housing market. When housing prices fell, mortgage defaults surged triggering a cascade of losses in mortgage-backed securities and other opaque assets.
Major financial institutions—investment banks and insurance underwriters deeply intertwined with the global financial plumbing—had trillions of dollars in exposure. As housing prices collapsed, it was clear the value of mortgage-backed assets was crashing. But by how much? No one knew for sure.
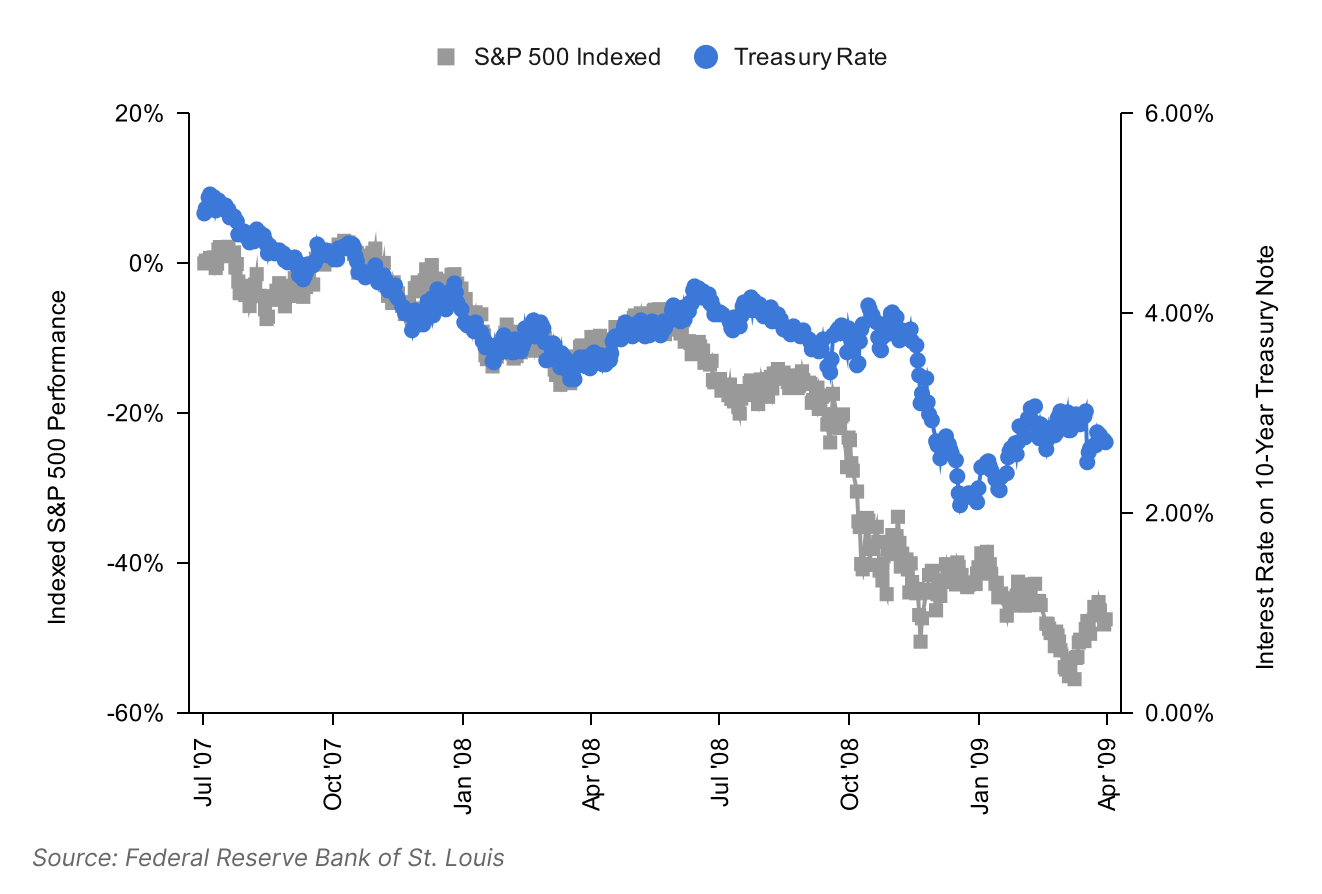
The stock market began to fall in the second half of 2007. Treasury yields fell in parallel as investors moved assets to safety. In March 2008, the Fed brokered a deal for Bear Stearns—a major bank heavily exposed to subprime losses—to be acquired by JP Morgan. This reassured the market. Investors expected the Fed would maintain financial stability if other banks needed rescuing.
However, on September 15th, 2008 Lehman Brothers filed for bankruptcy. The market expected the Fed to broker a deal similar to Bear’s. When the Fed didn’t, the S&P 500 went into free fall. Stocks crashed by 25% over the following two weeks. Treasury yields spiked briefly as investors feared the collapse of the system. Credit markets were frozen (Figure 3).
The government ramped up stabilization efforts after Lehman failed. It rescued AIG, funded the Troubled Asset Relief Program (TARP), injected capital into banks, aggressively cut rates, and even started buying mortgage-backed securities. Immediately treasury yields dropped sharply as the flight to safety resumed. By March 2009, markets had stabilized.
The Global Financial Crisis was an extremely serious and complex event. Daily and weekly treasury yield movements are inherently very noisy. But the overall trends provide a clear picture: treasuries are a safe haven, unless the life of the system is in doubt.
Onset of the COVID Pandemic, 2020
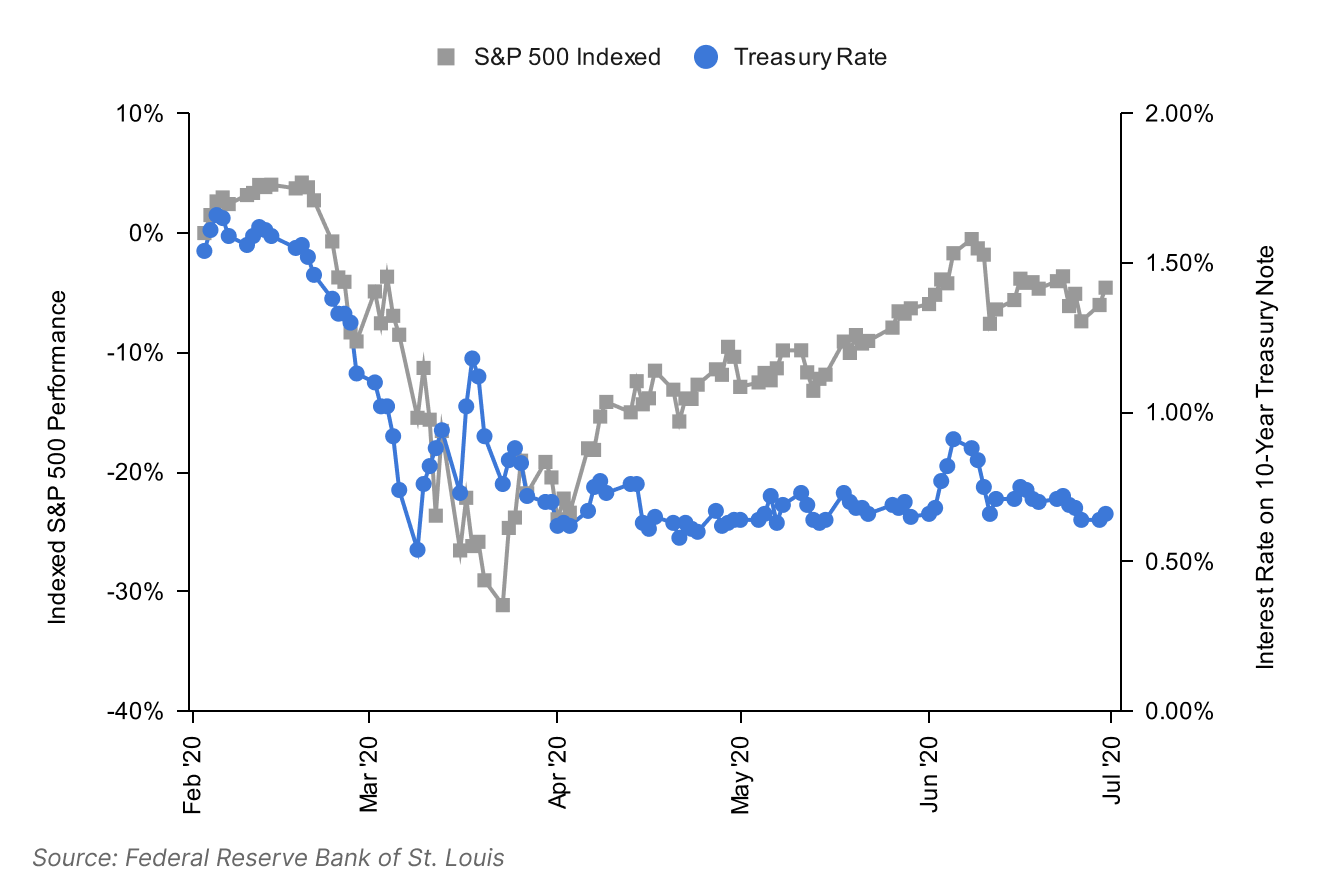
In late 2019, reports emerged of a novel coronavirus in China. By February 2020, there were cases in Europe and the United States. In March 2020, the WHO declared a global pandemic.
This triggered nationwide lockdowns and economic shutdowns across the world to try to contain the virus. Fearing a collapse in global demand, the stock market crashed by more than 30%. Treasury yields declined by 100 basis points as investors flooded in at first (Figure 4).
On March 9th, as the crisis deepened, investors were forced to sell treasuries to cover losses. More importantly, investors and companies needed to maximize liquidity—that is, they needed cash, not just safety. No one knew how long the shut downs were going to last. Companies didn’t know whether they would generate revenue and needed cash to stay afloat.
The treasury market broke down. The Fed launched massive interventions from March 12th through 23rd to purchase treasuries, add emergency liquidity, and cut rates. Treasury markets normalized.
The financial crisis triggered by the COVID pandemic was brief. The behavior of treasury yields matched previous episodes of instability. A stock market crash led to lower yields as investors rushed to safety. Forced selling and market breakdowns drove yields temporarily higher. Government action stabilized markets ending the temporary dislocation.
How did treasury yields respond to the Liberation Day tariffs
On Wednesday April 2nd, President Trump announced tariffs on most US imports. The move towards tariffs wasn’t necessarily a surprise. The policy was a core part of his campaign.
However, the magnitude of the tariffs—Japan at 24%, Vietnam at 46%, among others—and in particular, the methodology basing the tariffs on the US trade deficit with each country, shocked the markets and the world. The S&P 500 declined by almost 5% on Thursday and again by another 6% on Friday (Figure 5).
Treasury yields moved down slightly on Thursday and Friday—about 19 basis points in aggregate. By Monday, treasury yields were increasing sharply. By Friday April 11th, they had gained 50 basis points.
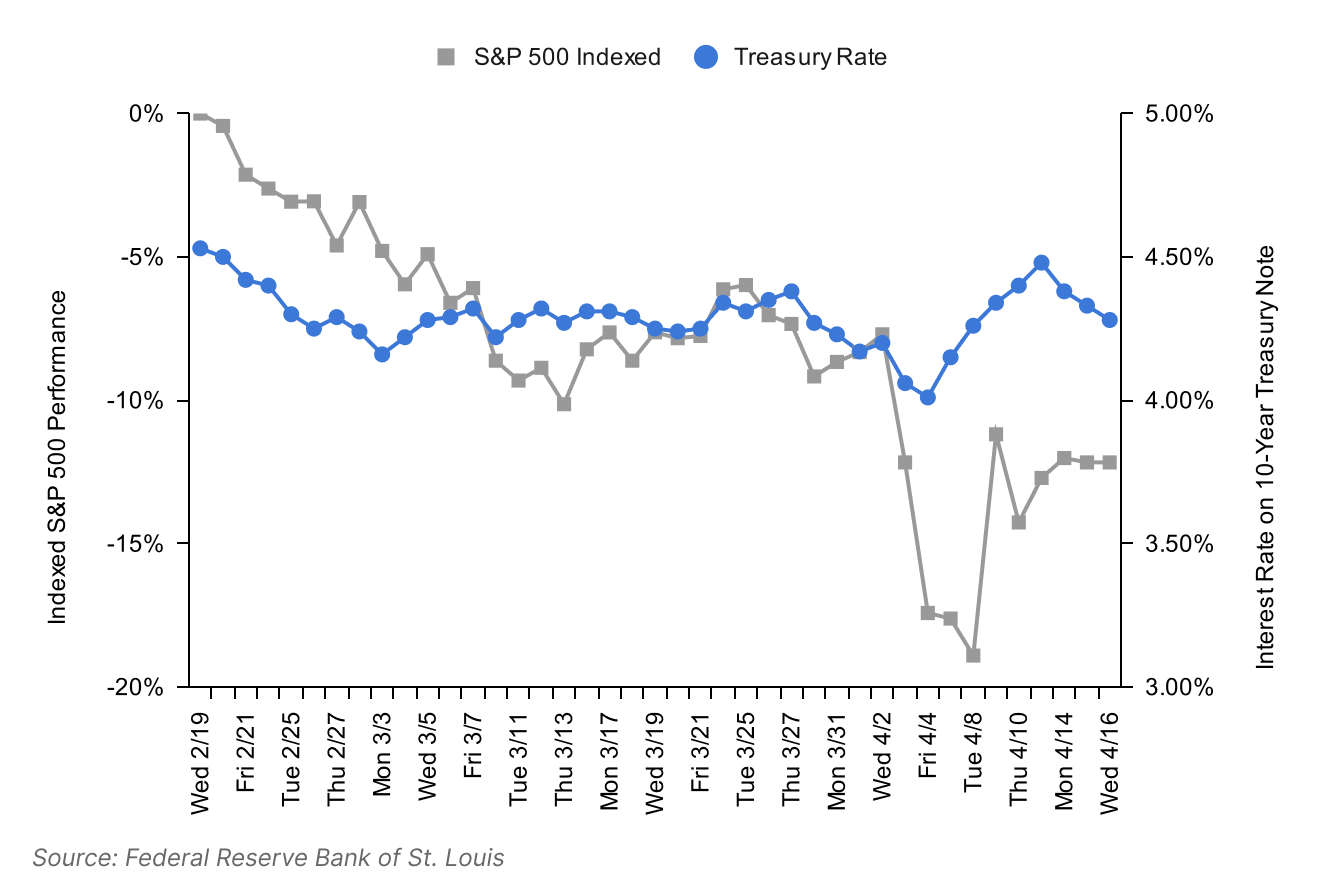
Notably, President Trump announced a 90-day pause to the tariffs on Wednesday April 9th saying, “The bond market is very tricky. I was watching… I saw last night where people were getting a little queasy.” The pause was widely welcomed by the stock market which reversed half of its post-Liberation Day losses. Treasury yields rose through Friday but started to ease this week giving back 20 basis points.
It’s too early to tell exactly why treasury yields dislocated from historical patterns and rose while the stock market was crashing. The two competing theories are:
Similar to previous stock market crashes, investors may have been forced to sell treasuries to cover losses thus increasing yields. This theory relies on hedge funds unwinding their basis trades.7 This would mostly align with previous crashes.
The leading theory is that markets perceive US trade policy as erratic, and the Trump administration’s approach to governing as chaotic—more whimsically vindictive than reliably stable. Naturally, foreign central banks have been diversifying their dollar holdings into other currencies—the dollar’s share of central bank foreign reserves has declined 7% since 2017 according to The Economist.8
It may be a combination of both, but preliminary signs—mainly weakness in the dollar and anecdotal surveys of international investors—point to an erosion of trust in the US as a safe haven. The picture may clear up a bit in mid-June when the US Treasury releases the Treasury International Capital (TIC) Data for April.
Some of these trends date back to 2022 when the US, under the Biden administration, and its allies froze Russian foreign reserves following the invasion of Ukraine in February 2022. Gold has since appreciated 75% while inflation-adjusted treasuries have underperformed by almost 15% according to the Wall Street Journal.9
A shift away from the US may prove tricky. Less demand for US assets would likely mean declining stock markets, rising interest rates, and potentially lower business investment. That might result in less jobs, lower incomes, and an economic slowdown. All of that would dent demand for US assets further and make it harder to maintain a robust economy. Importantly, it would increase the budget deficit and therefore the need for the US to borrow more.
If foreign demand were to fall sharply, the Fed might absorb some of this supply in the secondary market. But the consequences of doing that indefinitely are untested at best.
It’s still too early to tell, but never too early to listen
For now it’s worth keeping an eye on treasury yields. So far this week, markets are quiet—the S&P 500 is up 0.6% and treasury yields are down 20 basis points.
In the meantime, there are signs of distress across supply chains. The probability of a recession is 55% according to betting markets. Consumer sentiment is near all-time lows. 12-month inflation expectations are at their highest since 1981.
All of that could change in a heartbeat. Make sure you’re listening for it.
The history of how 10-year notes became the most widely traded bond in the world is spotty. This seems to have evolved organically over time driven by two factors: (i) the rise of the dollar as the global reserve currency after World War II, and (ii) the need for a baseline interest rate to benchmark against. Specifically, mortgages are a very large debt market in the US. Even though the standard terms for fixed-rate mortgages are 15 and 30 years, the average time to repayment is 7-8 years.
The price borrowers pay for the probability of default is referred to as credit risk. Technically, the price borrowers pay for the time value of money is referred to as duration risk. This is typically differentiated from the price borrowers pay to compensate a lender for inflation risk. At a high level, time value of money captures both. But if you’re ever in a room with economists, don’t conflate duration and inflation risks. You might get kicked out.
The face‑value interest rate on a note is fixed and set on day one. The yield is the return buyers earn by purchasing the note at its current market price. Suppose you lend Bob $100. He promises to pay you back the $100 in ten years. In the meantime, he will pay you $5 per year, or 5% interest. Now suppose that Bob gambles his savings away, and his ability to pay back the $100 is doubtful. You were happy earning $5 per year when you thought Bob was money good. Now you’re worried about getting your $100 back. If someone offers you $80, you might sell him Bob’s loan and let him worry about it. In this case, Bob’s loan is said to yield 6.25% ($5 / $80). Whoever buys the loan from you will only be investing $80, but they will still be earning $5 per year. As long as Bob keeps paying interest…
Specifically, the federal funds rate is the rate at which depository institutions can lend to each other through the Federal Reserve system. These are financial entities legally authorized to accept deposits from customers including commercial banks, savings and loans, credit unions, cooperative banks, and certain branches of foreign banks in the US.
The Fed doesn’t set long-term interest rates directly. However, the Fed can influence them indirectly by issuing forward guidance or directly by engaging in the market as a buyer or seller through its Open Market Operations. Under certain market conditions, this can meaningfully lower or raise long‑term rates.
Inflation battles are a special case where stock markets decline while treasury yields increase. However, the causality runs backwards for these. The Fed first raises rates to try to bring down inflation. The Fed signals that it will continue to raise rates gradually for the foreseeable future. Naturally, that increases treasury yields as investors anticipate interest rates increasing over time. The rise in interest rates makes the present value of a company’s future cash flows worth less. That in turn drives down stock prices. These episodes lead to gradual declines in the stock market, not major crashes with one possible exception—1973-1974, which included Watergate, an oil embargo, and Nixon’s resignation.
Hedge funds have been making small profits by buying treasuries and selling treasury futures. The futures are identical in structure but sometimes sell at a slight premium due to supply-demand imbalances—basically futures require less cash upfront, which makes them more attractive to certain pension funds and insurance companies. This trade is often funded by lots of debt to amplify returns, often $20 borrowed for every $1 of equity invested, occasionally higher. When treasury rates spike, the trade ceases to be profitable and hedge funds are forced to sell treasuries to cover their debts.
“How Trump might topple the dollar.” The Economist, April 16th 2025.
“The Dollar and the Bond Market’s Ominous Message for Trump.” Wall Street Journal, April 10th 2025.